Satellite images have become a ubiquitous part of our daily lives, even if many of us don’t realize it. Whether you see them on the evening news, on the Weather Channel, on the internet, or in some other venue, satellite images are practically everywhere. They permeate the modern media, in advertising, in television series, and at the movies. In scientific and technical disciplines, images are used to forecast water shortages, to predict crop yields, and to monitor forest fires, volcanic eruptions, and earthquake damage. Yet, despite their pervasive nature, most of us know very little about how satellite images are acquired, processed, and analyzed.
Earth Observation Day, a cooperative educational project between AmericaView and the U.S. Geological Survey, aims to change this. Working with both K-12 and undergraduate students and faculty, AmericaView and the USGS are embarking on a national outreach and education effort that introduces students to the power and excitement of remote sensing, engaging them in lessons and activities that take the mystery out of remote sensing and connect it STEM education at all levels of the K-12 curriculum. Clearly the need is well recognized – American students rank below students in many other countries in the critically important STEM disciplines of Science, Technology, Engineering, and Mathematics. However teachers often don’t have the knowledge, materials, or support necessary to introduce remote sensing into the science, geography, mathematics, and social science curriculum, even though the ‘fit’ can be made seamlessly and in a way that engages students in active, participatory learning.
The idea behind Earth Observation Day is to fill this need in each of AmericaView’s state partners. Working together, AmericaView, the StateViews, and the USGS have developed educational materials and a web site to host and support the event. The site provides remote sensing educational materials, and links to other resources such as posters, texts, on-line image galleries, and much more.
As examples of activities that occurred on March 24th, 2010, the first official AmericaView Earth Observation Day, Dr. Tom Mueller, associate professor at California University of Pennsylvania, lead a land use / land cover mapping exercise with 150 students. They identified a U.S. university of their choice, and created a map that they could use to determine the ‘livability’ of the area (green space, proximately to public land, etc.). Dr. Mueller, who directs Cal U’s GIS Club, challenged the students in the AmericaView Remote Sensing Image Memory game, followed by a Landsat cake.
Students at Laramie Junior High, Wyoming, were introduced to remote sensing and application satellite images through a lecture titled “Earth Observation – An Introduction to Remote Sensing.” Dr. Ramesh Sivanpillai of WyomingView spent two days and talked to 112 students in six 8th grade physical science classes. Among other topics, the students learned about satellite sensors and electromagnetic spectrum, and how unique information exists in wavelengths that are invisible to the human eye. They also learned about the career opportunities available in remote sensing.
In West Virginia, Dr. Rick Landenberger, AmericaView Executive Director, spent the day at Oak Glen High School, talking with 107 students in 9th grade physical science and 10th grade biology classes. After a lecture on remote sensing principles, the students helped Dr. Landenberger map the land cover within their local watershed using a Landsat scene draped over aerial imagery in Google Earth. The students will follow this with a field day to nearby Tomlinson Run State Park, where they’ll collect land cover ground reference data to check their maps, ultimately linking land use – land cover to water quality and quantity as part of a larger GLOBE project.
These are a few of the organized activities that occurred. The web site offers lessons and activities that can be implemented with very little technical knowledge of remote sensing. In future years the AmericaView consortium and USGS plan to develop more coordinated projects, perhaps linking to GLOBE through a coordinated land cover mapping field campaign, like the MUC-A-THONS developed by New Hampshire View and GLOBE Land Cover PI Dr. Russ Congalton.
Wednesday, April 21, 2010
Tuesday, April 13, 2010
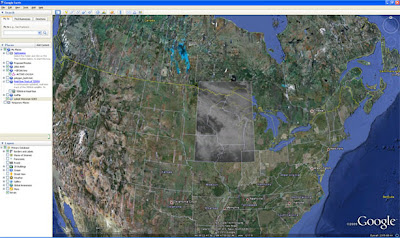
Adding WMS to GoogleEarth
by Sam Batzli, WisconsinView
One of the many (and somewhat hidden) features of GoogleEarth is the capability of adding custom OGC Web Map Services (WMS). The connection to the WMS and its content can then be saved as a KML file and shared with others. Any user who opens the file in GoogleEarth will automatically add the WMS to their GoogleEarth session in the same configuration in which it was saved.
Here's how to do it.
1) Launch GoogleEarth
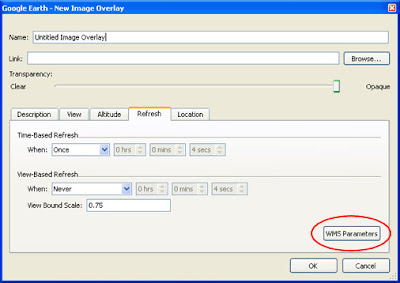
2) From the "Add" menu, select "Image Overlay"
3) You should get a dialogue box like this when you select the "Refresh" tab.
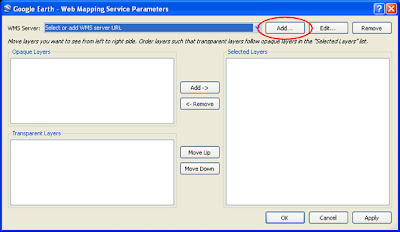
4) Click on "WMS Parameters"
5) A dialogue box like the following should appear...
6) You may select a WMS from the drop-down list...
or add your own by clicking "Add..."
7) Enter the URL for a working WMS in the dialogue box such as...
http://speedy.ersc.wisc.edu/cgi-bin/latest_wi_goes?
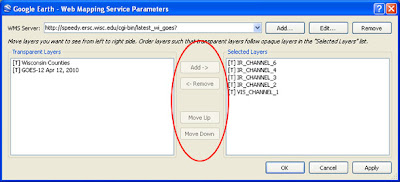
8) If your WMS is valid, you should get a list of layers to choose. [T] = Transparent and is based on the configuration of the WMS. Select and arrange the layers for viewing with the middle buttons.
9) If you are using my WMS example, select any combination of Channels 1 through 6 and arrange them so that the layer you want on top is at the bottom of the stack (counter intuitive, I know).
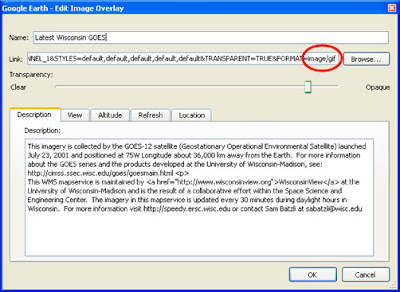
10) Finally, give the layer a title and some descriptive information. This interface seems to default to a GIF image type. For most imagery you will want to use PNG and that can be changed in the "Link" (see above). Once the WMS is placed on the globe, you can return to the properties by right-clicking the layer name. This is also where you "Save Place As..." KMZ or KML (KMZ is just Zip-compressed KML). I recommend using the initial saved KML as a starting point. In a text editor you can enhance the KML by separating layers, adding buttons, descriptions, and even logos. (See the KML Reference for more info).
This example uses this KMZ
That's it! Have fun!
An Overview of eCognition Segmentation Algorithms
This video is the second AmericaView object-based image analysis (OBIA) virtual seminar series. This video is intended for users new to eCognition or for those users looking to improve segmentation performance. Jarlath O'Neil-Dunne from the University of Vermont provides an overview of the most common segmentation algorithms available in eCognition including:
- Incorporate thematic (vector) datasets by turning them into image objects
- How to reduce processing time by stringing together multiple segmentation algorithms, using sub-levels, and maps
- Alternatives to multiresolution segmentation
- Compare segmentation results using maps.
Labels:
eCognition,
LiDAR,
OBIA,
Segmentation
Monday, April 5, 2010
OhioView SATELLITES Geospatial Technology Conference
K-12 and university students present their research projects based on geospatial technology
Presented by:
OhioView & Penta Career Center
9301 Buck Road, Perrysburg, OH
K-12 and university students present their research projects based on geospatial technology
Presented by:
OhioView & Penta Career Center
9301 Buck Road, Perrysburg, OH
April 27, 2010
4:00 pm to 8:00 pm
4:00 pm to 8:00 pm
Penta Career Center
9301 Buck Road
Perrysburg, OH 43551
9301 Buck Road
Perrysburg, OH 43551
Contact: Kevin Czajkowski, 419-530-4274, kczajko@utnet.utoledo.edu
K-12 and university students from Ohio will present their research results from work they performed throughout the school year. The National Science Education Standards state that students learn the concepts and facts of science, obtain reasoning and procedural skills of scientists, and understand that the nature of science is a particular form of human endeavor (National Research Council, 2000).
Subscribe to:
Posts (Atom)