Thursday, October 28, 2010

2010 AmericaView Fall Technical Conference


What a fantastic meeting!

Sam Batzli, Maria Vasys, and the folks at the University of Wisconsin-Madison's Space Science and Engineering Center deserve a round of applause and heart-felt congratulations for hosting three days of insightful talks, effective committee meetings, stimulating workshops, amazing tours, and (so I'm told) scenic and interesting field trips. With well over 60 in attendance, this was once of our best meetings to date.

One of the most exciting things for me was to witness how we're forging closer and more effective ties between the StateViews. We've always been plugged into our respective state's needs, and we've done well over the years of adapting our resources to best meet those needs, but the examples of states working more closely together to further leverage our assets is, to me, remarkable. I know that we're all feeling a bit pinched lately, with too much to do and too few resources. But we're not letting this bog us down or dampen our enthusiasm - cooperative, coordinated regional and other joint projects are actually increasing! The research group, in particular, seems to be hitting its stride, with the identification of several critical and timely applied research ideas. Furthermore, the outreach group identified a number of projects that will support the newer members of the consortium as they grow their state consortia and become more closely integrated into the larger consortium. Thank you both, Rick Lawrence of MontanaView, and Kevin Dobbs of KansasView, for stepping up. The education group continues to work with K-12 science teachers across the country in advancing STEM education through Earth Observation Day and various other local and state events, and the Technology group has a few exciting projects underway as well, including the new multi-state data services project. Jay Morgan's and Tyler Erickson's groups, including the Alaska contingent and Larry Biehl, Board Chairman extraordinaire and walk-off pinch-hitter for Technology, also deserve our thanks. What great energy!

Rest assured that the Board and staff appreciates your feedback via the follow-up survey, and is already beginning to broadly organize our Winter Business Meeting in DC. By that time we'll know more about the elections and will have a better sense of how things might shake out politically. That said, and recognizing the tremendous need to continue to work together to meet our objectives, there is no better time to build on our network's strengths of cooperation and mutual support. Thanks again for all of your contributions - expanding the many uses of remote sensing could not be a more timely nor a more critically important endeavour. You're work makes a difference in the lives of many people across the country.


Wednesday, April 21, 2010

AmericaView's Earth Observation Day 2010

Satellite images have become a ubiquitous part of our daily lives, even if many of us don’t realize it. Whether you see them on the evening news, on the Weather Channel, on the internet, or in some other venue, satellite images are practically everywhere. They permeate the modern media, in advertising, in television series, and at the movies. In scientific and technical disciplines, images are used to forecast water shortages, to predict crop yields, and to monitor forest fires, volcanic eruptions, and earthquake damage. Yet, despite their pervasive nature, most of us know very little about how satellite images are acquired, processed, and analyzed.

Earth Observation Day, a cooperative educational project between AmericaView and the U.S. Geological Survey, aims to change this. Working with both K-12 and undergraduate students and faculty, AmericaView and the USGS are embarking on a national outreach and education effort that introduces students to the power and excitement of remote sensing, engaging them in lessons and activities that take the mystery out of remote sensing and connect it STEM education at all levels of the K-12 curriculum. Clearly the need is well recognized – American students rank below students in many other countries in the critically important STEM disciplines of Science, Technology, Engineering, and Mathematics. However teachers often don’t have the knowledge, materials, or support necessary to introduce remote sensing into the science, geography, mathematics, and social science curriculum, even though the ‘fit’ can be made seamlessly and in a way that engages students in active, participatory learning.

The idea behind Earth Observation Day is to fill this need in each of AmericaView’s state partners. Working together, AmericaView, the StateViews, and the USGS have developed educational materials and a web site to host and support the event. The site provides remote sensing educational materials, and links to other resources such as posters, texts, on-line image galleries, and much more.

As examples of activities that occurred on March 24th, 2010, the first official AmericaView Earth Observation Day, Dr. Tom Mueller, associate professor at California University of Pennsylvania, lead a land use / land cover mapping exercise with 150 students. They identified a U.S. university of their choice, and created a map that they could use to determine the ‘livability’ of the area (green space, proximately to public land, etc.). Dr. Mueller, who directs Cal U’s GIS Club, challenged the students in the AmericaView Remote Sensing Image Memory game, followed by a Landsat cake.


Students at Laramie Junior High, Wyoming, were introduced to remote sensing and application satellite images through a lecture titled “Earth Observation – An Introduction to Remote Sensing.” Dr. Ramesh Sivanpillai of WyomingView spent two days and talked to 112 students in six 8th grade physical science classes. Among other topics, the students learned about satellite sensors and electromagnetic spectrum, and how unique information exists in wavelengths that are invisible to the human eye. They also learned about the career opportunities available in remote sensing.


In West Virginia, Dr. Rick Landenberger, AmericaView Executive Director, spent the day at Oak Glen High School, talking with 107 students in 9th grade physical science and 10th grade biology classes. After a lecture on remote sensing principles, the students helped Dr. Landenberger map the land cover within their local watershed using a Landsat scene draped over aerial imagery in Google Earth. The students will follow this with a field day to nearby Tomlinson Run State Park, where they’ll collect land cover ground reference data to check their maps, ultimately linking land use – land cover to water quality and quantity as part of a larger GLOBE project.


These are a few of the organized activities that occurred. The web site offers lessons and activities that can be implemented with very little technical knowledge of remote sensing. In future years the AmericaView consortium and USGS plan to develop more coordinated projects, perhaps linking to GLOBE through a coordinated land cover mapping field campaign, like the MUC-A-THONS developed by New Hampshire View and GLOBE Land Cover PI Dr. Russ Congalton.

Tuesday, April 13, 2010

Adding WMS to GoogleEarth

by Sam Batzli, WisconsinView

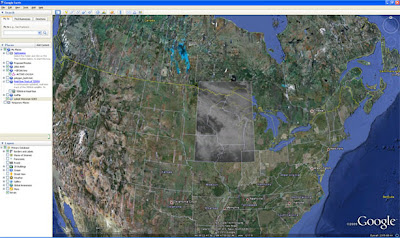
One of the many (and somewhat hidden) features of GoogleEarth is the capability of adding custom OGC Web Map Services (WMS). The connection to the WMS and its content can then be saved as a KML file and shared with others. Any user who opens the file in GoogleEarth will automatically add the WMS to their GoogleEarth session in the same configuration in which it was saved.

Here's how to do it.
1) Launch GoogleEarth
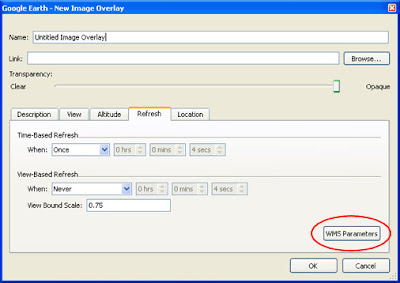
2) From the "Add" menu, select "Image Overlay"
3) You should get a dialogue box like this when you select the "Refresh" tab.

4) Click on "WMS Parameters"
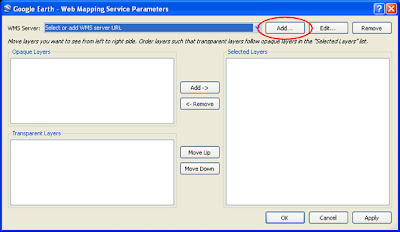
5) A dialogue box like the following should appear...

6) You may select a WMS from the drop-down list...
or add your own by clicking "Add..."
7) Enter the URL for a working WMS in the dialogue box such as...

http://speedy.ersc.wisc.edu/cgi-bin/latest_wi_goes?


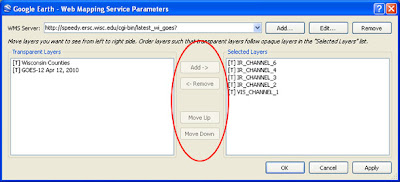
8) If your WMS is valid, you should get a list of layers to choose. [T] = Transparent and is based on the configuration of the WMS. Select and arrange the layers for viewing with the middle buttons.


9) If you are using my WMS example, select any combination of Channels 1 through 6 and arrange them so that the layer you want on top is at the bottom of the stack (counter intuitive, I know).


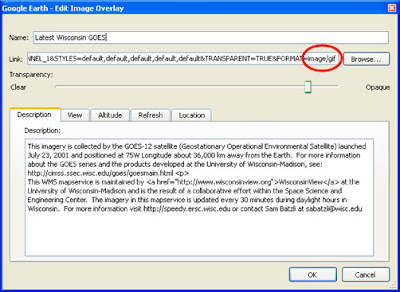
10) Finally, give the layer a title and some descriptive information. This interface seems to default to a GIF image type. For most imagery you will want to use PNG and that can be changed in the "Link" (see above). Once the WMS is placed on the globe, you can return to the properties by right-clicking the layer name. This is also where you "Save Place As..." KMZ or KML (KMZ is just Zip-compressed KML). I recommend using the initial saved KML as a starting point. In a text editor you can enhance the KML by separating layers, adding buttons, descriptions, and even logos. (See the KML Reference for more info).

This example uses this KMZ


That's it! Have fun!

An Overview of eCognition Segmentation Algorithms

This video is the second AmericaView object-based image analysis (OBIA) virtual seminar series. This video is intended for users new to eCognition or for those users looking to improve segmentation performance. Jarlath O'Neil-Dunne from the University of Vermont provides an overview of the most common segmentation algorithms available in eCognition including:
  • Incorporate thematic (vector) datasets by turning them into image objects
  • How to reduce processing time by stringing together multiple segmentation algorithms, using sub-levels, and maps
  • Alternatives to multiresolution segmentation
  • Compare segmentation results using maps.
If you are an eCognition user, you can download the project containing the data and the rule set from the eCognition Community web site.

Monday, April 5, 2010

OhioView SATELLITES Geospatial Technology Conference

OhioView SATELLITES Geospatial Technology Conference

K-12 and university students present their research projects based on geospatial technology

Presented by:
OhioView & Penta Career Center
9301 Buck Road, Perrysburg, OH

April 27, 2010
4:00 pm to 8:00 pm
Penta Career Center
9301 Buck Road
Perrysburg, OH 43551

Contact: Kevin Czajkowski, 419-530-4274, kczajko@utnet.utoledo.edu

K-12 and university students from Ohio will present their research results from work they performed throughout the school year.  The National Science Education Standards state that students learn the concepts and facts of science, obtain reasoning and procedural skills of scientists, and understand that the nature of science is a particular form of human endeavor (National Research Council, 2000).

Wednesday, March 17, 2010

Google's Earth Engine


In recent months Google has released some information on a new remote sensing analysis platform that they are developing called Earth Engine.  The platform will allow users to run remote sensing algorithms against petabytes of remote sensing data stored in the Google cloud.

The initial announcements were made right before the International Climate Change Conference (COP15) held Copenhagen in 2009.  The initial demo application was monitoring deforestation in the Amazon rain forest.

Source: Seeing the Forest through the cloud (The Official Google Blog)

More recently, an interview with Rebecca Moore, Engineering Manager of Earth Engine, describes more of the project's background, goals, and the intended launch (later this year in advance of COP16).

Many details of this platform are currently unknown, and those details will determine how useful the platform is to remote sensing scientists.  What level of processed data will be available? Will data be available before or after atmospheric correction (and if corrected, what algorithm)? Will the data be geolocated or resampled to a grid (and if so, what grid)?  What languages can be used to define the remote sensing algorithms?  What sensor datasets will be made available? Etc, etc, etc...

Despite the unknown details, it looks like this platform could be a valuable tool for remote sensing education, by enabling users to run and distribute remote sensing analyses to anyone with a web browser.  AmericaView will be watching this project to see how it progresses.

Thursday, February 25, 2010

Large Dataset Processing in eCognition: Overlapping Tile Method

This video is part of the AmericaView eCognition software tutorial series. It explains a work flow known as "Overlapping Tile Processing." Overlapping tile processing is an efficient method for processing very large datasets using eCognition Server. It is one way of overcoming the memory limitations that are inherent to object-based image analysis.

This presentation is recommended for intermediate to advanced users of eCognition.

Friday, February 12, 2010

We are making some changes to the REDDnet mirror of the Hazards Data Distribution System (HDDS) in an attempt to make REDDnet as much like HDDS as possible. The new procedures are included here. They have changed only slightly:

To access HDDS disaster_restricted data via REDDnet, proceed as follows:
Use a web browser to navigate to: "https://se1.accre.vanderbilt.edu/lodn/"

To access disaster_restricted data, log in with the disaster_restricted user name and password
double-click the disaster_restricted subdirectory (left side of the window)
double-click the the desired event, i.e. 201001_Earthquake_Haiti
continue navigating through the subdirectories to the desired data

To access public disaster data, select "browse files as guest.
double-click the "Disaster" subdirectory (left side of the window)
double-click "pub" and then= "data" subdirectories
continue navigating through the subdirectories to the desired data

Top download a file, click on it. Allow the request to access your computer (necessary to write files to your local disk)
A Java Web Start window will appear. Select the Output file location and number of connections.
Experiment for best performance. Connection values >20 are sometimes effective.
Optimal setting depends on network connection, CPU, etc.
Click the check boxes on several files and select "Download" under the "Operation:" pull down menu to download several files at once. PLEASE DO NOT SELECT ANY OTHER OPERATION!
Performance should be up to 10 times faster than downloading from HDDS, but results will vary.

Wednesday, February 10, 2010

Hazards Disaster Data System(HDDS) via REDDnet

The AmericaView/REDDnet project is now mirroring EDC Hazards Data Distribution System (HDDS) data. At present, only the disaster_restricted data is available. The HDDS disaster_restricted password is required and must be obtained from Brenda Jones at EDC before accessing these data. Later, the non-restricted data will be added as well and will be accessible without a password.

Only HDDS data for current events are mirrored on REDDnet. At the time of this posting, 201001_Earthquake_Haiti, 200909_Samoa_Tsunami and 200909_indonesia_Earthquake are available.

To access HDDS disaster_restricted data via REDDnet, proceed as follows:
Use a web browser to navigate to: "https://se1.accre.vanderbilt.edu/lodn/"
Enter "RSWG" for the user name and the HDDS disaster_restricted password.
On the left side of the screen select: "disaster_restricted"
On the left side of the screen select the event you are interested in. for example: "201001_Earthquake_Haiti"
Continue navigating through the directories until you get to the data you want. The directory structure matches HDDS.
Click on any filename to download it. Allow the request to access your computer (necessary to write files to your local disk)
A Java Web Start window will appear. Select the Output file location and number of connections
(experiment with the latter for best performance. Numbers larger than 20 are sometimes effective. Optimal setting depends on network connection, CPU, etc.)
Performance should be up to 10 times faster than downloading from HDDS, but results will vary.
Please let me know how it works for you.